


Background
The link between headaches and barometric pressure is frequently stated in daily conversations, yet few studies have given conclusive evidence correlating the two.
- Mukamal et al [1] studied records of 7054 patients seen over a 7 year period in a hospital emergency department with a primary discharge diagnosis of headache, concluding that high ambient temperature and low barometric pressure led to a significant increase in the risk of headache requiring emergency department evaluation
- ...and many others to do with migrane tbf.
The scope of many of these studies is limited to the link between barometric pressure and severe migrane cases requiring medical attention, in part due to the availability of such medical diagnostic records. No studies in the past have targeted cases of light to moderate headaches that previously would have passed unrecorded in medical data repositories.
Objectives
The purpose of this study is to determine the correlation between barometric pressure and cases of self-reported headaches.
Methods
Collection of headache self-reports
We collected self reports of headaches by scraping tweets containing the keyword “頭痛” (headache) originating in Japan between 2013/3/23~2013/4/6 (13 days). This dataset contains 262587 tweets, with about an average of 19000 headache tweets per day. We were unable to collect data from some times within this period due to technical difficulties. Fig1 shows the number of occurrence of headache tweets for every hour in the time period. Note that the geographical distribution of tweets inside Japan is unknown, since most tweets do not contain location data finer than country level.


By normalizing the raw number of tweets by this hourly average and standard deviation, we derive the normalized headache risk which, intuitively, tells us how much more headache tweets there were in that hour than usual.

Collection of barometric pressure data
We collected barometric pressure data from the Japan Meteorological Agency website. For our study, we use the hourly sea-level pressure data for Tokyo (lat: 35.69 lng: 139.76)
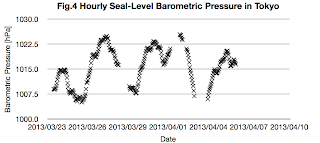
We compare the absolute value of the barometric pressure with the number of tweets, as well as the change in the barometric pressure over a time window (the gradient of the pressure curve for the past n hours). Fig.5 shows the differential over the past 12 hours, an arbitrarily chosen time window.


Results
We compare the barometric pressure with the normalized number of tweets for every hour, and calculate the correlation for n=262 points.
○ Absolute pressure vs normalized number of tweets
We only found very weak negative correlation (R=-0.19, p<0.01).
Comparing the change in pressure over the past 12 hours with the relative number of headache tweets, we found moderate negative correlation (R=-0.31, p<0.001)

Discussion+Results
While the correlation is relatively low, this result suggests that increase in the occurrence of headaches is related to the decrease of barometric pressure, while it is less related to the actual value of the pressure. These findings agree with previous findings[1].
or something.
References
[1] Kenneth J. Mukamal, MD, Gregory A. Wellenius, ScD, Helen H. Suh, ScD and Murray A. Mittleman, MD, DrPH, Weather and air pollution as triggers of severe headaches, Neurology March 10, 2009 vol. 72 no. 10 922-927
他の分析エントリ
- 山手線リアルタイム混雑情報で遊んでみよう- 140文字の「重み」を言語毎に比較してみた
- 世界で一番住みやすい場所を計算してみた
- サイゼリヤの間違い探しが難しすぎたので大人の力で解決した
- 建物のWifiをホッピングして東京から大阪まで通信できるか
- Topcoderに一番有利な時間帯を調べてみた
- Wikipediaのデータで人生解析をしてみよう
- 本当に土日は雪が多いの?っていう話
- 明日の天気を過去の似た日から合成して可視化してみよう
0 件のコメント:
コメントを投稿